Retail Cash Flow
- Adam Edwards
- Feb 1
- 5 min read
Cash Flow

Larger companies (Walmart, Home Depot) generate far more cash and can afford aggressive investments and shareholder distributions. Companies like Walmart and Home Depot are balancing investment and shareholder returns, whereas smaller players like Dollar Tree might be conserving cash for future expansion. Dollar General and Dollar Tree are the weakest in cash flow generation and investment activity. Dollar Tree and Dollar General focus on budget-conscious consumers, leading to lower cash generation. All companies are reinvesting, but at different scales depending on their market position and financial strategy.
Company-by-Company Analysis
1. Costco Wholesale Corporation. Costco generates strong cash from operations, which suggests efficient working capital management and profitability. Negative investing cash flow indicates investment in assets, possibly expanding stores or infrastructure. Negative financing cash flow suggests debt repayment, dividend payments, or share buybacks.
2. Dollar General Corporation. Lower operating cash flow than Costco, indicating lower profitability or working capital pressures. Investing cash outflows suggest continued expansion or upgrades. Financing cash flow is slightly negative, implying lower levels of debt repayment or fewer shareholder distributions.
3. Dollar Tree, Inc. Weakest operating cash flow suggests lower efficiency or profitability. Investing outflows indicate asset purchases, but at a modest level compared to larger companies. Small negative financing cash flow suggests minimal shareholder distributions or debt repayments.
4. Lowe’s Companies, Inc. High operating cash flow suggests strong profitability and effective working capital management. Negative investing cash flow indicates significant investment in stores, technology, or equipment. Negative financing cash flow suggests debt repayment, share buybacks, or dividends.
5. The Home Depot, Inc. Extremely high operating cash flow, likely due to strong sales and margin management. Negative investing cash flow suggests reinvestment in business operations or acquisitions. Large negative financing cash flow likely reflects significant debt repayments or aggressive share buybacks.
6. Walmart Inc. The highest operating cash flow highlights Walmart’s dominant market position and robust profitability. Heavy investing outflows suggest aggressive expansion, store upgrades, or acquisitions. The most negative financing cash flow indicates large debt repayments, dividend payouts, or major share buybacks.
Net CF v FCF

Comparative Analysis
All companies have positive Free Cash Flow, meaning they all generate excess cash from operations after covering capital expenditures. Most companies have net cash flow near zero or negative, indicating that they are reinvesting profits into business growth or shareholder returns. Large retailers (Walmart, Home Depot, Lowe’s) have significantly higher free cash flow than discount retailers (Dollar Tree, Dollar General).
Walmart and Home Depot dominate in free cash flow generation but reinvest so aggressively that their net cash flow is near zero or negative. Costco is in a similar position, with strong free cash flow but negative net cash flow, likely due to high reinvestment or shareholder distributions. Lowe’s is managing to keep positive net cash flow despite strong free cash flow, suggesting more conservative cash management. Dollar Tree and Dollar General generate free cash flow but at much lower levels, reflecting their smaller scale and possibly tighter margins.
Company-by-Company Analysis
1. Costco Wholesale Corporation Costco generates strong free cash flow, meaning it has high cash from operations after capital expenditures. However, its net cash flow is negative, suggesting heavy outflows from financing or investing activities. This could indicate significant share buybacks, dividend payments, or debt repayments.
2. Dollar General Corporation
Dollar General is generating free cash flow, indicating profitability after capital expenditures. Its net cash flow is close to zero, meaning its cash inflows and outflows are nearly balanced. This could suggest a conservative approach to financing or investing activities.
3. Dollar Tree, Inc. Dollar Tree has minimal net cash flow, indicating limited excess cash after all activities. Its free cash flow is positive, but much lower than the bigger retailers. This suggests Dollar Tree has tighter profit margins or higher capital expenditure relative to its cash generation.
4. Lowe’s Companies, Inc. Lowe’s has strong free cash flow, suggesting robust profitability and disciplined capital expenditure. Positive net cash flow indicates that despite investments or financing activities, it is still generating excess cash. This suggests an efficient balance between reinvestment and shareholder returns.
5. The Home Depot, Inc. Home Depot has massive free cash flow, meaning strong earnings after capital investments. Net cash flow is close to zero, meaning it is spending almost all of its cash from operations. This suggests aggressive share buybacks, dividends, or strategic reinvestments.
6. Walmart Inc. Walmart generates the highest free cash flow, reflecting its massive scale and strong cash management. However, negative net cash flow suggests significant outflows from financing or investing activities. This likely indicates major capital expenditures, debt repayments, or share repurchases.
FCF Growth

Costco Wholesale Corporation: Negative FCF growth, indicating a decline in free cash flow over time. This could be due to higher capital expenditures or increased costs. Costco is the only company with negative FCF growth, meaning its cash flow is deteriorating.
Dollar General Corporation: The highest FCF growth by far, suggesting strong operational improvements or better cash flow efficiency. Dollar General is experiencing a surge in free cash flow, suggesting an operational efficiency boost.
Dollar Tree, Inc.: Modest growth, but much lower than Dollar General.
Lowe’s Companies, Inc.: Slightly positive FCF growth, suggesting steady but not aggressive improvements.
The Home Depot, Inc.: Small but positive FCF growth, indicating stable cash flow management.
Walmart Inc.: Minimal growth, close to zero, meaning Walmart’s free cash flow is relatively flat.
FCF Margin
FCF Margin = Free Cash Flow / Revenue (higher margin = more efficient cash flow generation)

Costco Wholesale Corporation: Lowest FCF margin (~2%), meaning it retains little free cash flow relative to revenue. Costco has the lowest margin, likely due to its business model (low-margin, high-volume).
Dollar General Corporation: Mid-range margin (~4%), indicating reasonable efficiency. Dollar Tree and Dollar General have mid-range margins, reflecting stable but not exceptional cash flow efficiency.
Dollar Tree, Inc.: Similar to Dollar General, with a slightly lower margin.
Lowe’s Companies, Inc.: High FCF margin (~9%), indicating excellent cash flow efficiency. Home Depot and Lowe’s have the best FCF margins, meaning they are the most efficient at turning revenue into cash flow.
The Home Depot, Inc.: Highest FCF margin (~10%), meaning Home Depot is the most efficient in converting revenue into free cash flow.
Walmart Inc.: Moderate margin (~3%), suggesting lower efficiency in cash flow generation compared to Home Depot or Lowe’s.
Debt / FCF
Debt / FCF = Total Debt / Free Cash Flow (higher ratio = more debt compared to cash flow)
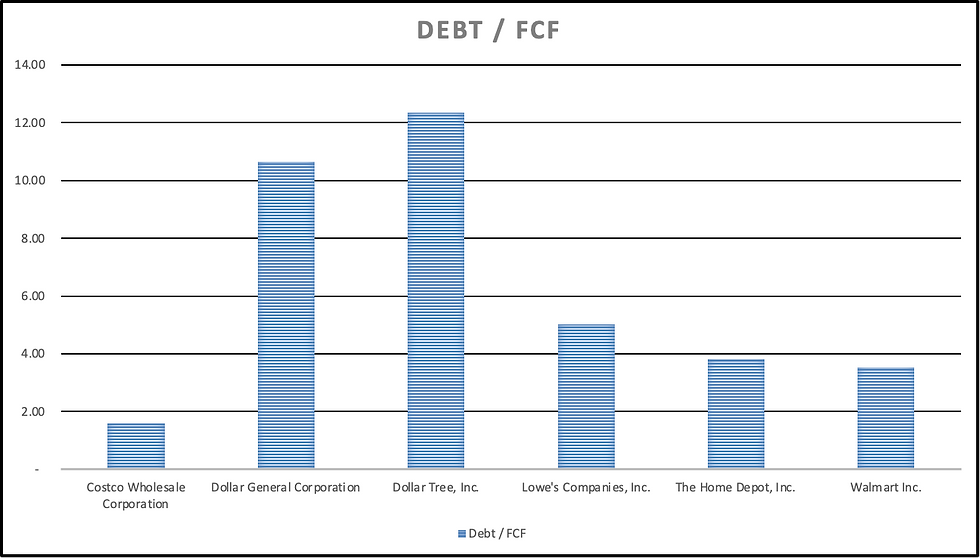
Costco Wholesale Corporation: Lowest debt-to-FCF ratio (~2x), meaning it has very little debt compared to its cash flow. Costco and Walmart have the lowest debt relative to cash flow, meaning they are financially strong.
Dollar General Corporation: High debt-to-FCF (~10x), suggesting heavy debt reliance. Dollar Tree and Dollar General have the highest debt-to-FCF, suggesting they rely on debt for growth.
Dollar Tree, Inc.: Highest debt-to-FCF (~12x+), meaning it has the most debt relative to cash flow.
Lowe’s Companies, Inc.: Moderate (~6x), meaning it carries some debt but is not over-leveraged.
The Home Depot, Inc.: Lower (~4x), suggesting strong financial stability. Home Depot and Lowe’s have moderate leverage, meaning they balance debt with strong free cash flow.
Walmart Inc.: Low (~3x), indicating Walmart manages debt well relative to its cash flow.
